

Read Time: 4 minutes
For the last few weeks, the U.S. stock market has gone through some significant volatility, influenced by shifting broad market sentiments as well as newly implemented tariffs on many of the U.S.’s trading partners.
During such periods of uncertainty, it can be frustrating to be an investor. But it is important to remember that markets are cyclical; there are ebbs and flows and ups and downs. The last few years have been somewhat of an outlier. 2023 and 2024 passed by with above-average, positive equity market returns with little in the way of market pullback. Now, the market has turned in the other direction for the first 10% pullback (in the S&P 500) in almost two years.
Market Performance in Context
Market Performance in Context
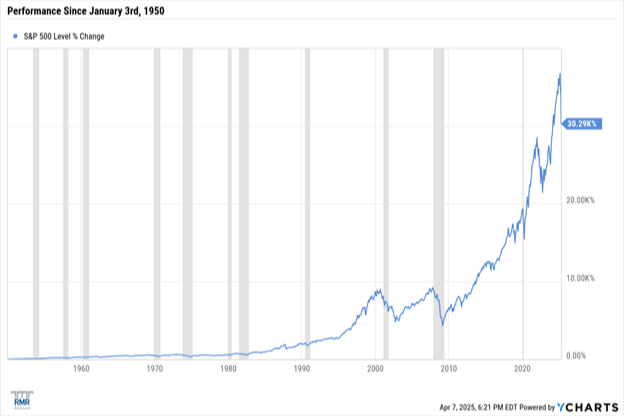
Since 1950, the S&P 500 Index has consistently climbed upward. In that same span, the market has experienced a number of corrections and pullbacks, often coinciding with times of economic uncertainty or recessions (recessions indicated by vertical grey bars on the chart).
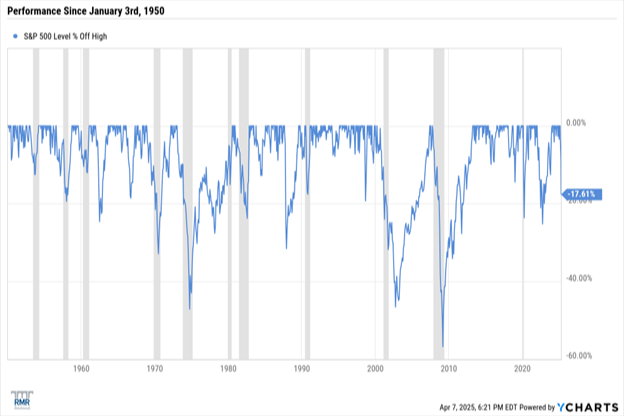
Despite the concern and fears that investors might have in seeing these negative marks on the market, they are surprisingly more common than one might imagine.
- 10% corrections in the market occur approximately every 1-2 years. They are usually short-lived and can result from geopolitical events, economic news, or changes in market sentiment.
- 20% corrections are a bit less common but still expected with market cycles, occurring once every 2-5 years or so.
- 30% corrections are less frequent and are normally indicative of periods of significant financial stress. Since the 1950s, there have only been 6 such drops including major financial crises such as the dot-com bubble and the global financial crisis.
Market Recoveries and NOT Timing the Market
Despite the frequency with which pullbacks occur in equity markets, it is best to remain invested for the long term. The adage, “it’s not about timing the market, but about time in the market,” has been proven true over the years. Looking at the historical performance of the S&P 500, there is a clear directional trend from the bottom-left to the top-right. Long-term, the index has had positive returns and has weathered all of the aforementioned market drawdowns.
To that point, there are clear and distinct downsides to trying to “time the market.” Many investors have attempted to predict and time market drops and runs (after all, in order to do this successfully, you have to be right twice!), but none have succeeded at doing it consistently over the decades.
The simple fact is that most pullbacks recover just as quickly as they drop. Taking the late 2018 trade war as an example, the market pulled back approximately 17% from its high (from September to December of 2018). By April of 2019, it had returned to its previous high mark. The S&P 500 then went on to return over 30% for the year of 2019.
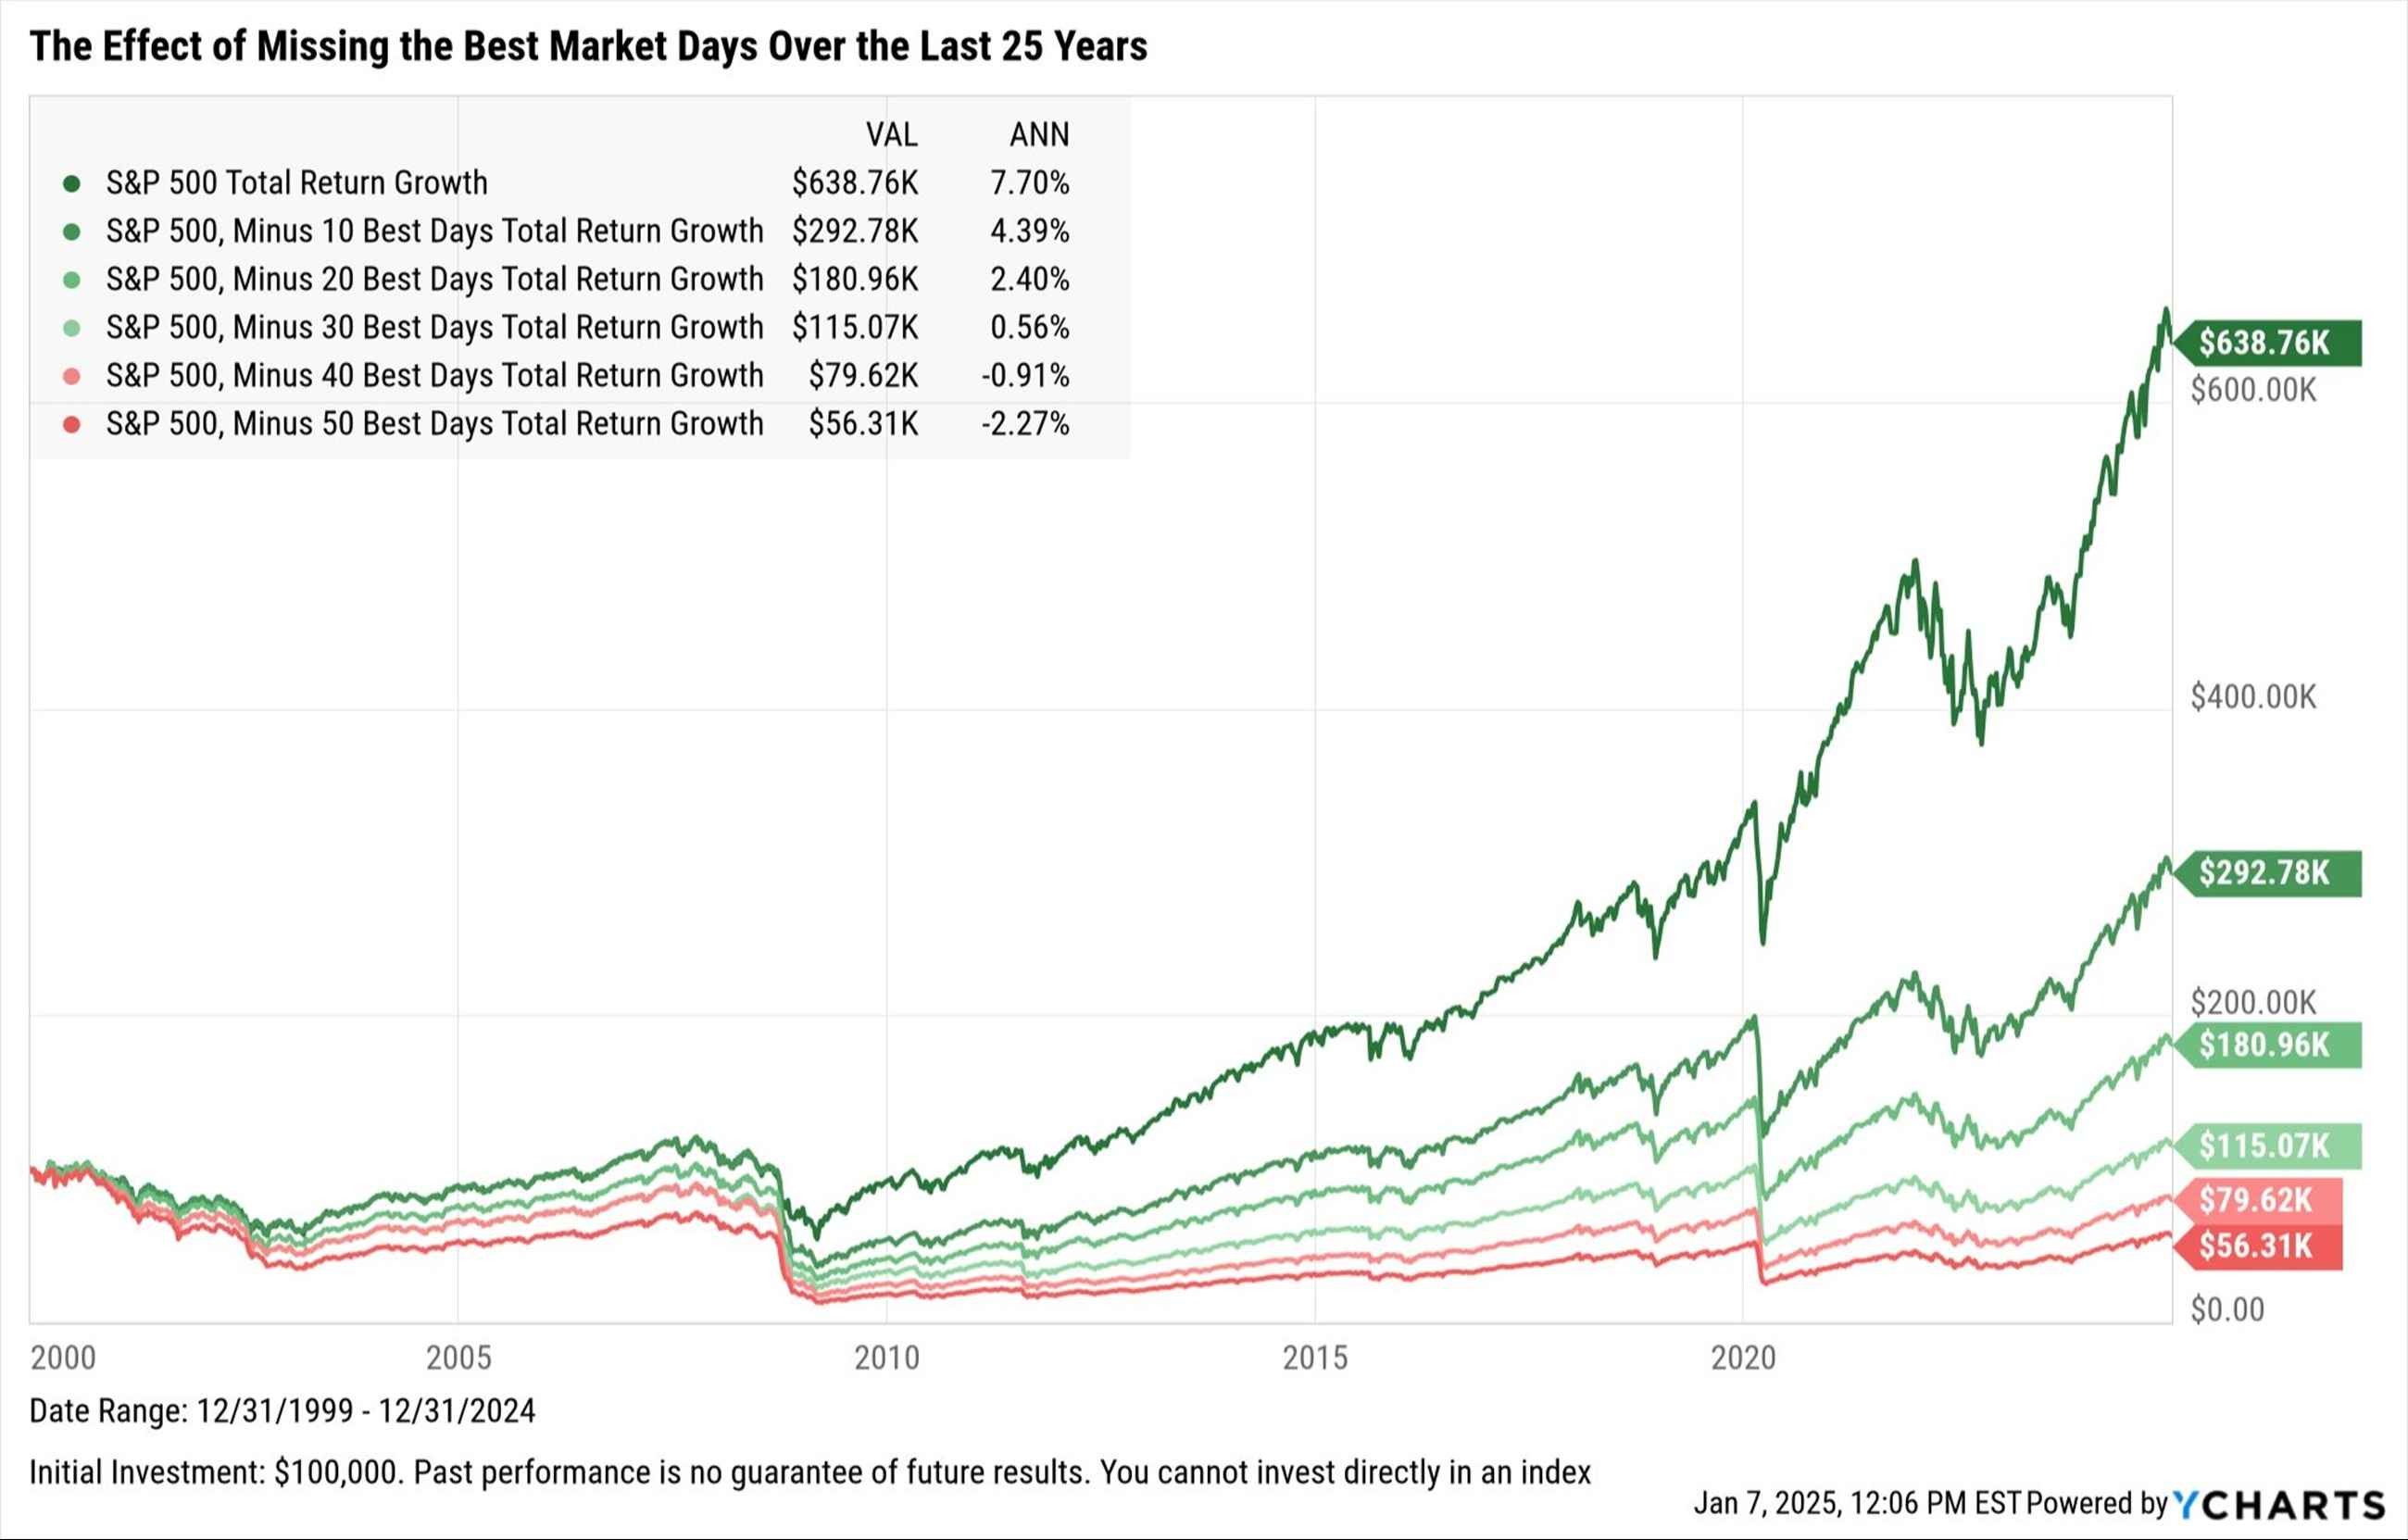
The above graph illustrates what missing some of the best days in the market can potentially do to an investment portfolio. We recommend staying invested longer, as being prudently invested through periods of economic volatility more often than not results in taking advantage of the totality of a market upswing.
The downsides to missing a potential strong year, month, or even day can have a measured impact on long-term returns.
Financial Planning and Accounting for Volatility
Emotions can lead to irrational decision-making that compromise the realization of stated goals. It is important to stay cognizant of long-term goals in spite of periods of market volatility. Doing so can have a great impact on the long-term outlook for your investment portfolio and whether it is a slew of tariffs, a financial crisis, or even a global pandemic, the market has proven that it can withstand uncertainty and volatility.
As always, our team is happy to help you discuss your options in a volatile environment. Reach out to your financial advisor, and they can assist you in discussing the markets and taking the appropriate approach.
1. YCHARTS, April 7, 2025
2. YCHARTS, January 7, 2025
3. YCHARTS, April 7, 2025
The content is developed from sources believed to be providing accurate information. The information in this material is not intended as tax or legal advice. Please consult legal or tax professionals for specific information regarding your individual situation.
Stocks are measured by the Standard & Poor's 500 (S&P 500) Composite Index, which is an unmanaged index considered to be representative of the overall U.S. stock market. Index performance is not indicative of the past performance of a particular investment. Individuals cannot invest directly in an index. The returns and principal values of stock prices will fluctuate as market conditions change. Shares, when sold, may be worth more or less than their original cost.
Investment advisory services offered through RMR Wealth Builders, Inc. RMR Wealth Builders, Inc. is not engaged in the practice of law or accounting. The opinions expressed and material provided are for general and educational information, and should not be considered a solicitation for the purchase or sale of any security. Past performance is not a guarantee of future results. All investment strategies have the potential for profit or loss.
RMR Wealth Builders, Inc. is a registered investment adviser with the SEC and only transacts business in states where properly registered or are excluded or exempted from registration requirements. Registration with the SEC or any state securities authority does not imply any level of skill or training.